
Guide: Tracking engagement and Analytics
Time to read: 20 ~ 40 Minutes
Operating System: Windows/Mac Computer
Web Browser: Google Chrome (recommended)
Table of Contents
There are several mechanisms across the tools to help you track student engagement content.
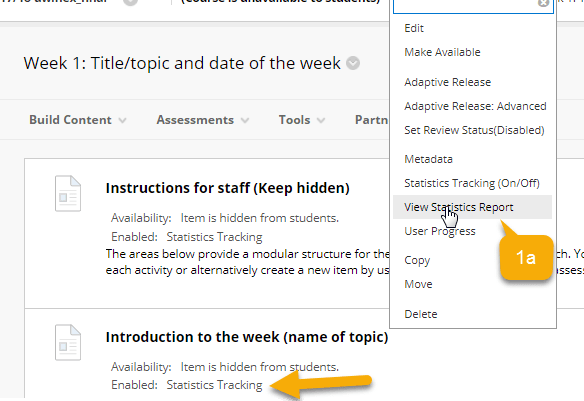
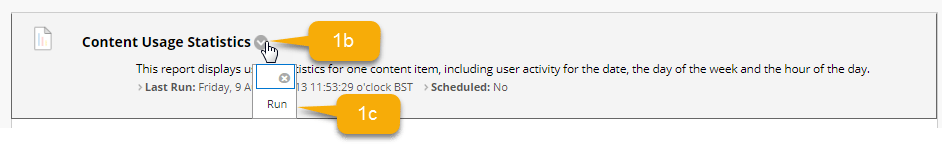
1- Statistical tracking in a single Blackboard item
This report displays usage statistics for one content item, including user activity for the date, the day of the week and the hour of the day.
To view the reports for these individual items click view statistical report (this will only appear if statistics tracking has been enabled).
2- Module reports and evaluations
The course tools area provides instructions with an array of reports on module engagement. Additional guidance on this can be found on Blackboard’s help guides.
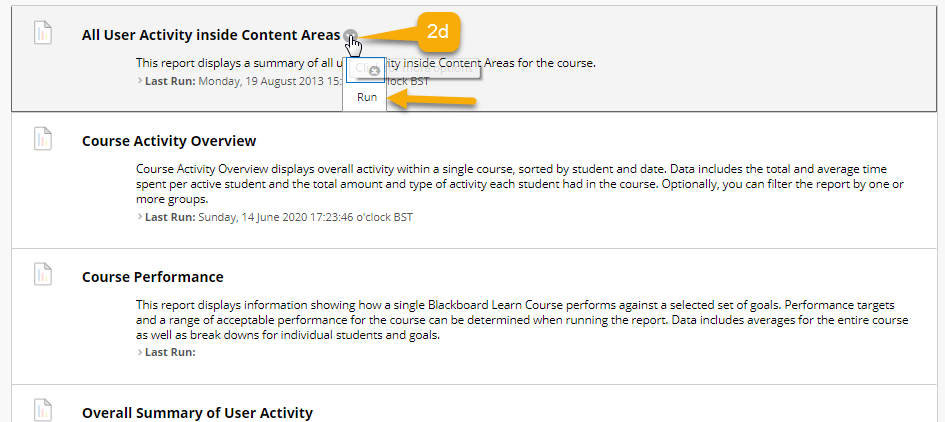
Go to Course Management>Evaluation>Course Reports.
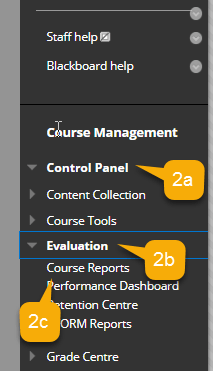
Choose the report you would like to run.
3- Collaborate engagement reports
After a Blackboard Collaborate session, you are able to run reports on who attended the session, how long they attended and until what time. This comprehensive guide shows how. You can find out more on the teaching hub.
4- UWL Replay (Panopto) statistical tracking and engagement
Panopto’s statistical analytics allow creator and system admins to track engagement on videos within the platform. This includes tracking engagement with interactive resources such as quizzes and data on an individual user level. Find out how on Panopto’s guidance on statistics and analytics.
